The hourly energy balance graph shows grid consumption at hours when there is surplus energy
In the hourly energy balance graph you may encounter a situation where, despite having a large amount of surplus energy, you are still importing energy from the grid.
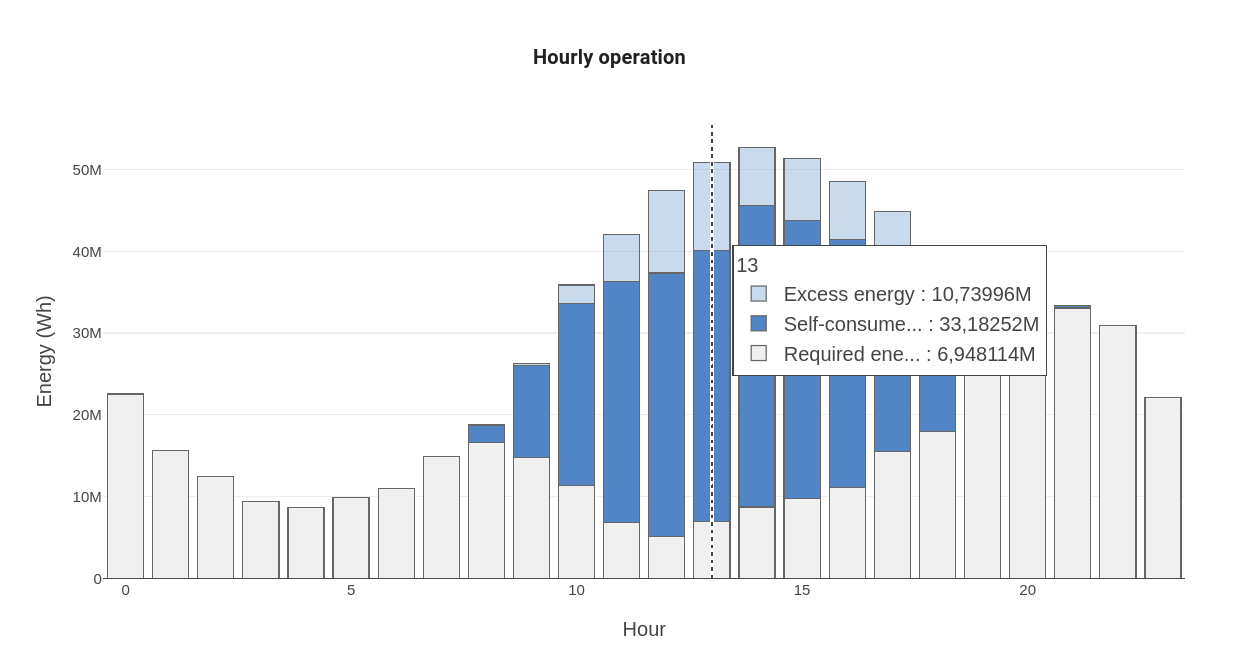
The graphs represent the aggregated balances for a whole year. For example, in the 12 o'clock bar you can see all the aggregated balances of the 8760 hours of a year between 12:00 and 13:00.
In this way, in a single bar you can see reflected at the same time the surpluses of some summer days (when there is more production) and the energy required from the grid on some cloudy winter days (when production drops a lot).