Profitability
One of the most important sections of the proposal for your client is the one that details the results of savings and profitability, both monthly (first year) and total (throughout the simulation period).
These results take into account the energy consumed and the energy fed into the grid, as well as the energy prices for each hour of the year and the taxes depending on the country.
Monthly
In this section, your client can view the total and monthly savings for the first year.
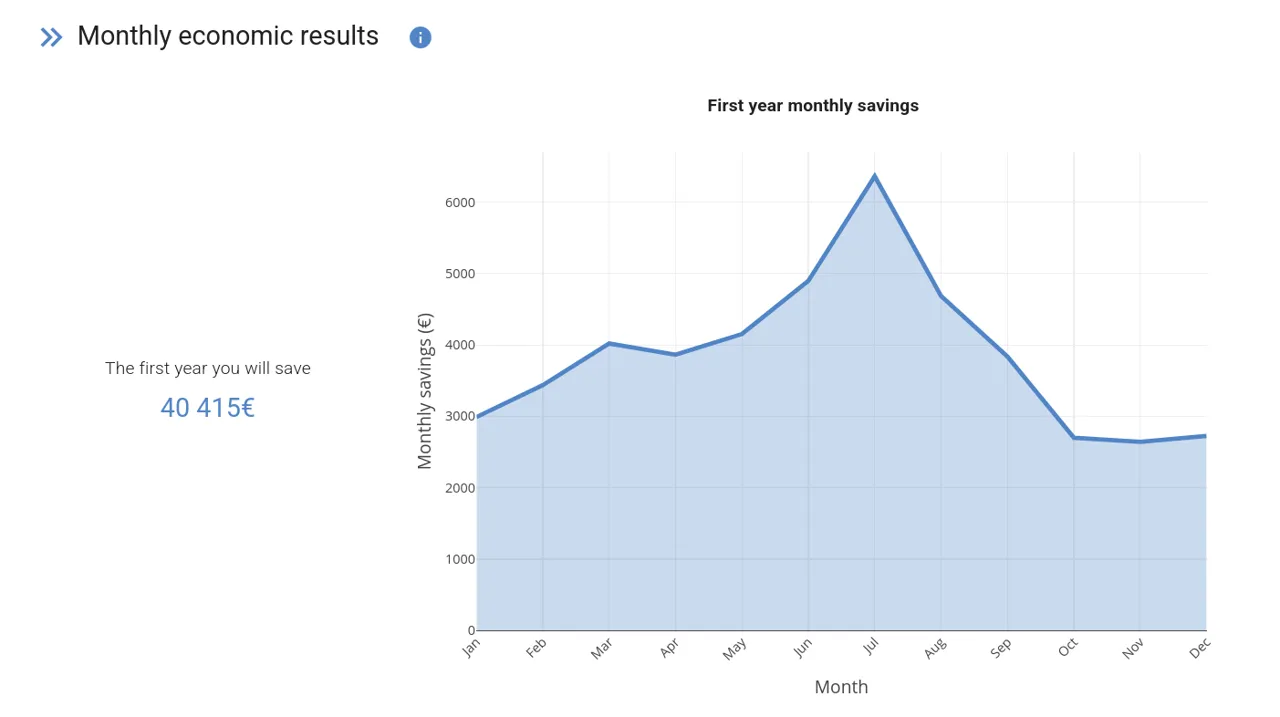
INFO
Occasionally there may be "peaks" in this graph, such as the ones you can see in the month of March and July in the example. These peaks are not due to abrupt changes in production, but to abrupt changes in tariffs, which may have a variable price depending on the month of the year.
Total
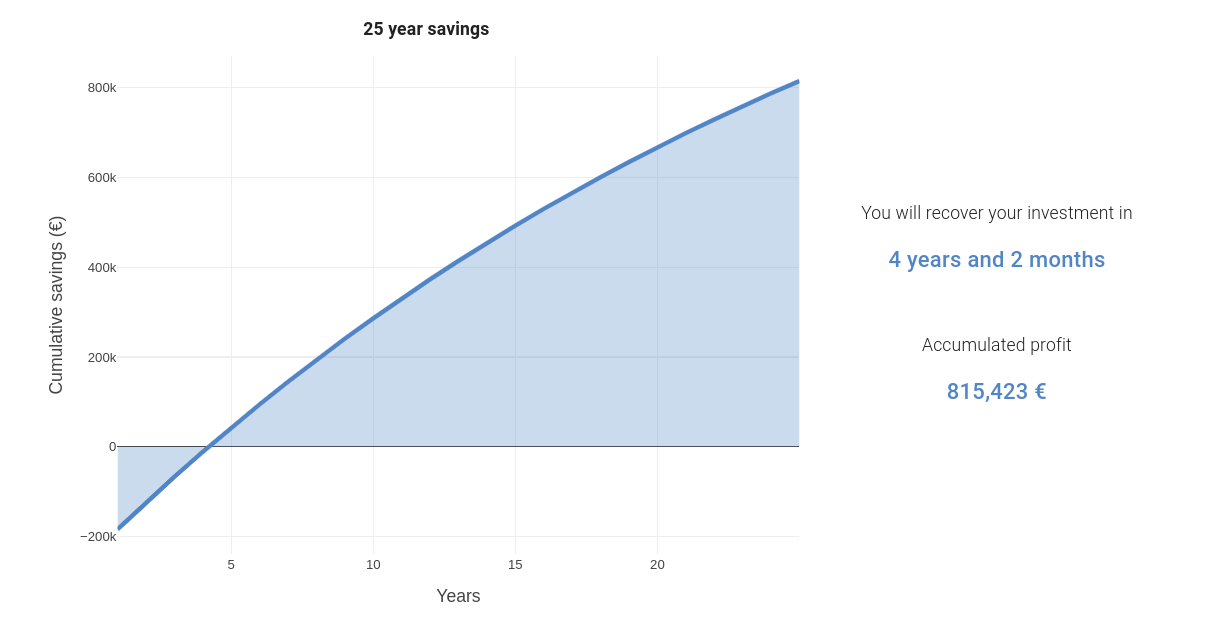
In this graph your client can visualise the cash flow of the investment during the simulation period (typically 25 years), taking into account the financial parameters.
The expected savings are calculated in the same way as the monthly economic performance graph.
The payback represents the month in which the accumulated cash flow starts to become positive.
The accumulated profit is the final profit after the simulation period. As this is a dynamic cash flow with discount rate applied, this value represents the Net Present Value (NPV) of the investment.