Load profile
Selecting the Load curve option you can upload and visualize the load profile of your client.
Format
You can use any of the following configurations in your files:
- Formats: CSV (
.csv) and Excel (.xlsx). - Frequencies: hourly, half-hourly and quarter-hourly.
- Units: energy and power.
The platform takes care of automatically extracting the consumption data, as well as the timestamps so that you do not have to do any manual work. It currently supports hundreds of different formats used by distributors and other service providers.
INFO
If the file you are using is not compatible, you can use a template and, if it is a format that you frequently work with, request the addition of that new format.
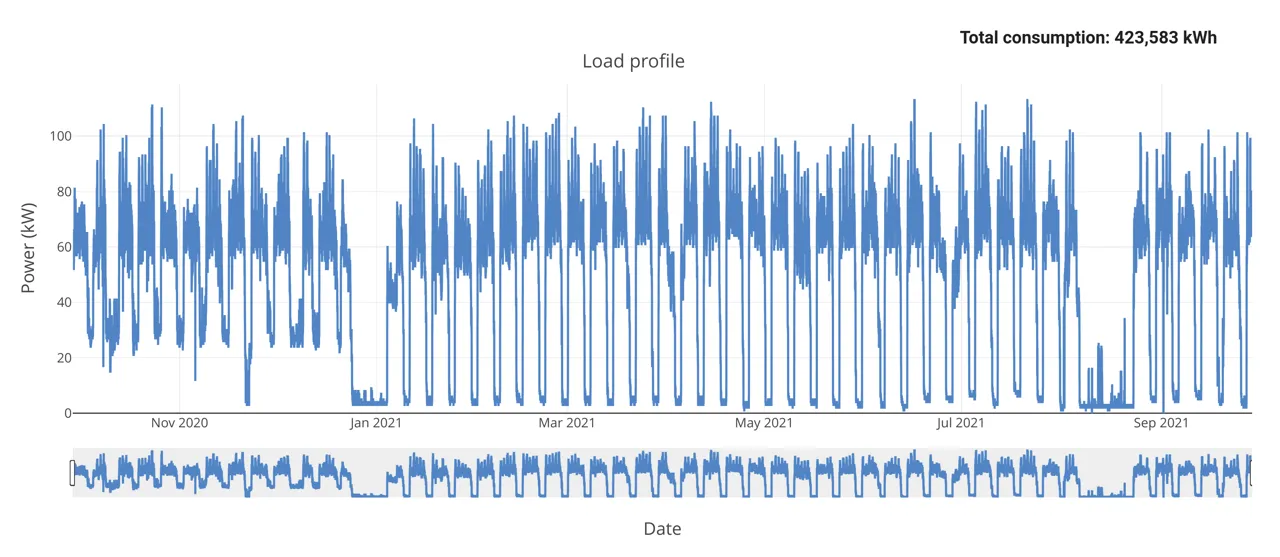
Multiple consumption files
You can upload multiple consumption files by using a single ZIP file:
- Select the files you want to upload.
- Right-click and choose the "Compress" option to create a ZIP file (
.zip). - Upload the
.zipfile to the platform.
The platform will automatically combine them into a single load profile.
INFO
If you encounter an unexpected gap in the load profile, it may be that one of the files inside the ZIP is incompatible with the tool.
Understand the load profiles
Load profiles are representations of the average power (kW) demanded per period. Typical periods are 1 hour (hourly load profile), 30 minutes (half-hourly load profile) or 15 minutes (quarter-hourly load profile).
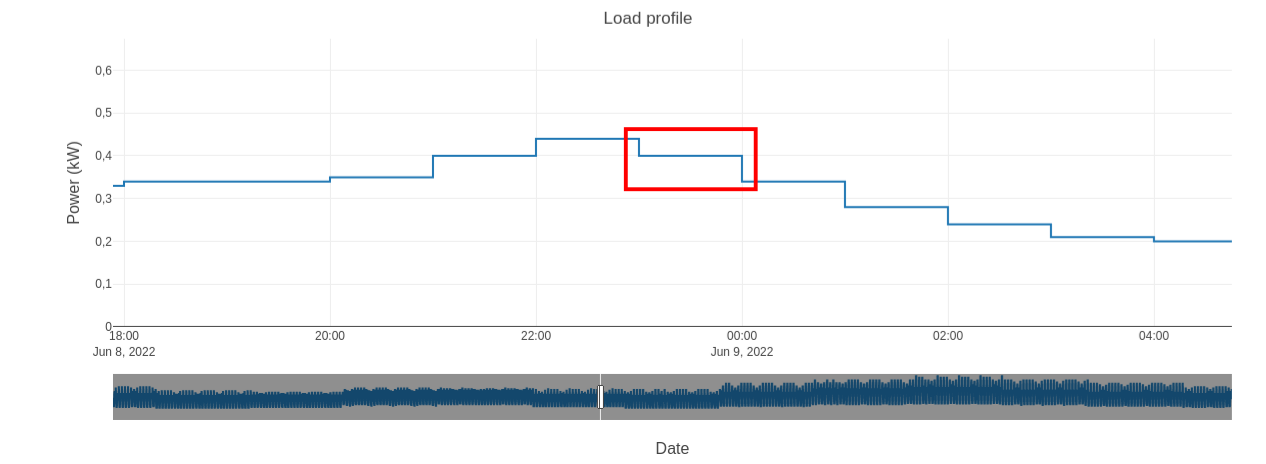
Hourly profile
In the following graph of an hourly load profile, the average power demanded within each hour of the day is clearly seen. In this case, calculating the energy consumed in an hour is trivial, as we can use the same power value. As an example, between 23:00 and 00:00 you can see that the average power demanded has been 0.4 kW, or in other words, between 23:00 and 00:00 there has been a total consumption of 0.4 kWh.
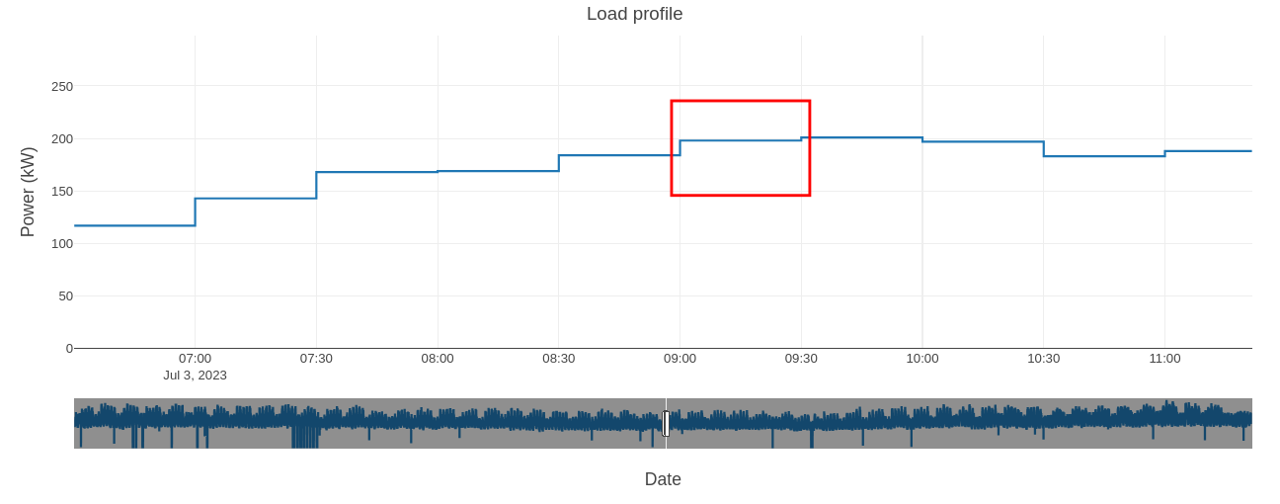
Half-hourly profile
In this graph, you can analyze the average power demanded in each 30-minute interval. To obtain the amount of energy consumed in each of these periods, divide the power by 2, thus transforming kW into kWh. For example, during the time interval between 09:00 and 09:30, the average power demand was 200 kW, which translates to a consumption of 100 kWh in that interval.
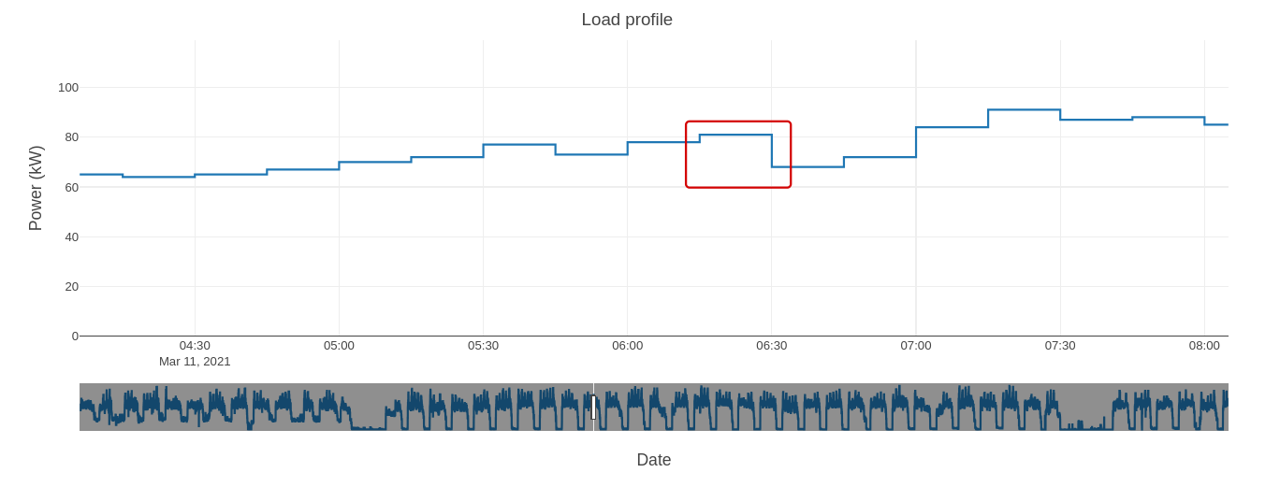
Quarter-hourly profile
In this other graph you can see the average power demanded within each 15 minute period. To calculate the energy consumed in each 15 minute period you must divide the power by 4, converting kW to kWh. For example, between 06:15 and 06:30 the average power demanded has been 80 kW which is equivalent to a consumption of 20 kWh between 06:15 and 06:30.