Annual insolation and annual solar access
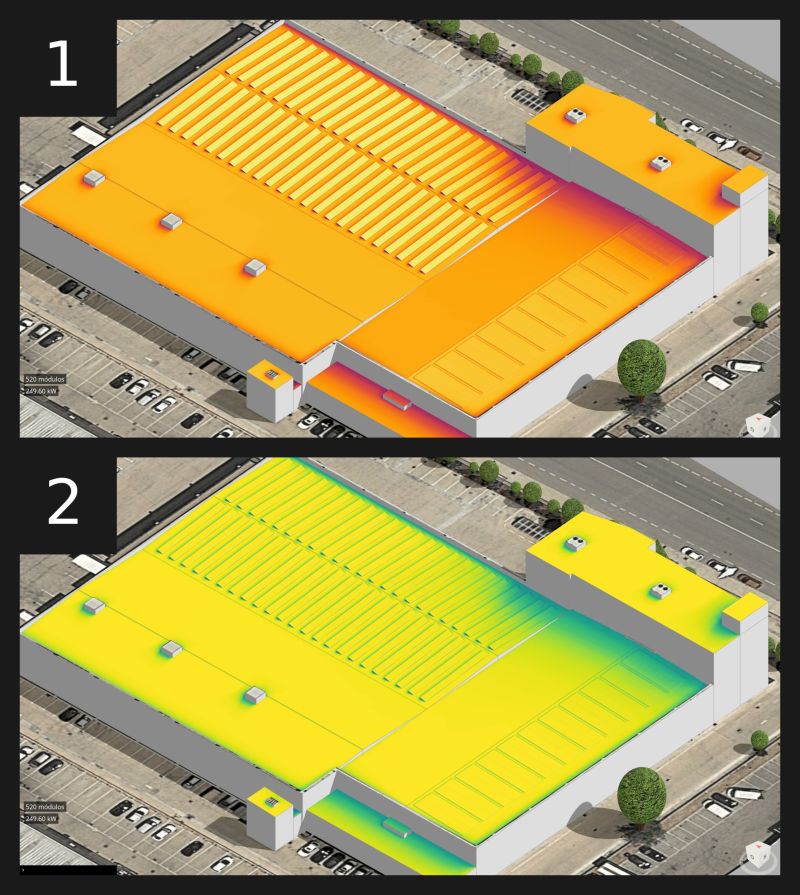
Can you tell the difference between these two images in a photovoltaic study? And no, it's not just about the colors used! 😊
In both cases, you can see the shading analysis result of all the rooftops and modules, taking into account nearby obstacles and the shadow cast by the modules themselves. However, each image represents different data and therefore has a different purpose.
1️⃣ The upper image shows the annual insolation on the rooftops and modules of the installation. In other words, the accumulated energy for each hour of the year and for each point within the 3D scene.
You can use the insolation calculation to determine which modules generate more energy. In this case, you can see that the tilted modules generate more energy than the co-planar modules, and logically, modules near the higher roof generate significantly less energy.
2️⃣ The lower image, on the other hand, shows the annual solar access. This means the amount of energy available in relation to the energy that could be received on each rooftop and module if there were no obstacles casting shadows.
You can use the solar access to study which modules are more affected by local shadows and thus avoid unnecessary losses. Furthermore, this parameter helps you determine how to best configure the module strings if you cannot avoid shadows.