Do you know how the typical meteorological year is calculated and why it's used?
🧐 You run a simulation for 25 years, get some results, and show them to your client, explaining what behavior is expected for their installation over the next 25 years. But have you ever considered what meteorological data is used during the simulation?
⛈️ No year is the same as another in terms of meteorology; that's why, for simulations over long periods of time, a "typical year" is often used to get the simulation results as close as possible to reality. This "typical year" is also known as a Typical Meteorological Year (TMY for its acronym in English).
🚀 It consists of a set of meteorological data for one year in a specific geographic location. The data is selected from the hourly data of a longer time period (10 years or more, according to the ISO 15927-4 standard). For each of the 12 months, the most representative months from all the years are selected and concatenated, with smoothing between transitions, to construct the full year.
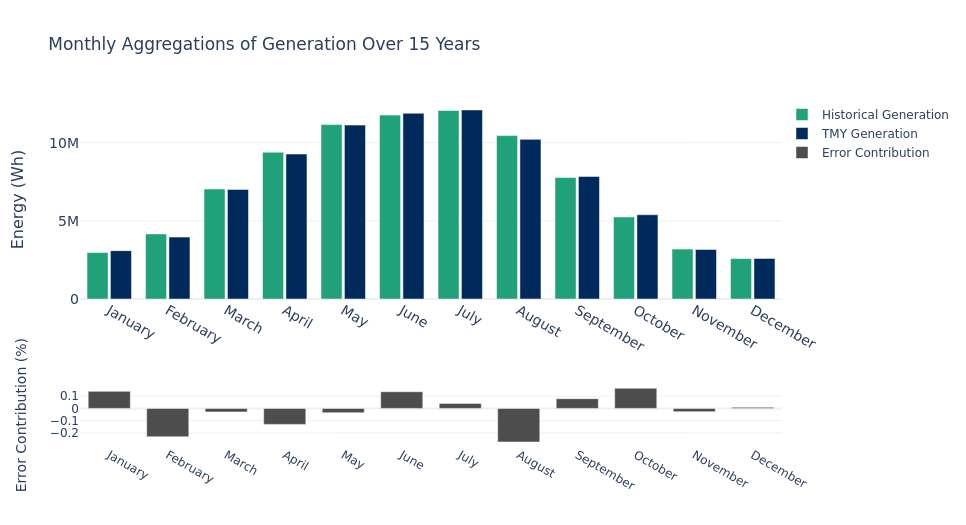
🤓 To verify if the typical year is statistically representative, we conducted simulations for 20 different locations from 2005 to 2020, comparing TMY generation with generation based on historical data for this period. By summing up all the generations from various locations over 15 years, we obtained the aggregated results on the graph.
By aggregating generation over multiple years and locations, the overall relative error is reduced to 1.057%.