Step 3. Selection of electricity tariffs, typical consumption and generation of proposal
With the 3D design ready, all that remains is to enter the electricity tariffs and typical consumption, generate the proposal and share it with the client.
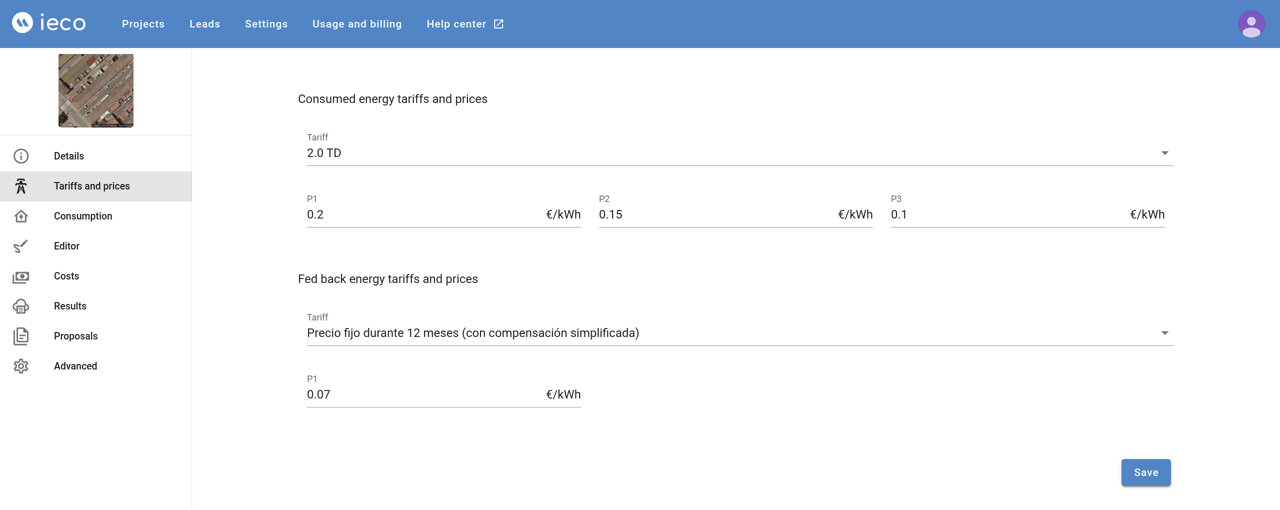
Prices of energy consumed and generated
Click on the tariffs and prices section.
In the first tab you can select the tariff that applies to the energy consumed. For this first project, we will choose option 2.0 TD and fill in the prices of the imported energy.
In the second tab you can select the tariff that applies to the energy generated. For this first project, we will choose the option Fixed price for 12 months (simplified compensation) and fill in the price of the surplus compensation.
INFO
Available tariffs depend on the geographical area and the current applicable regulation.
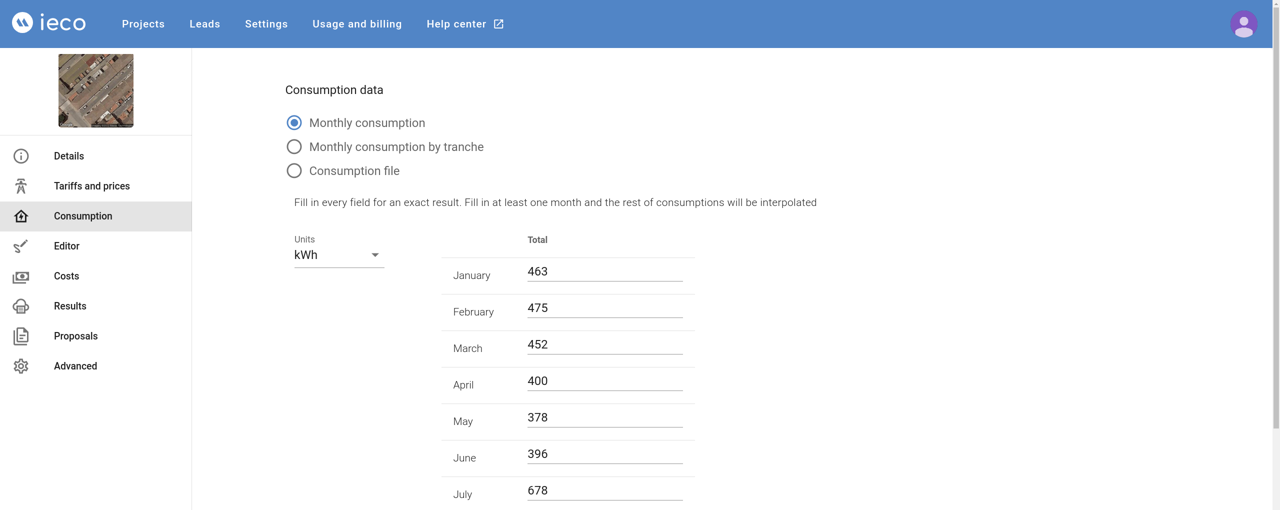
Consumption data
Click on the consumption section.
There are three main options for entering consumption profiles. From the most basic and less precise option in which monthly consumption is entered to the most complete option in which a file with the hourly consumption for at least one year is attached.
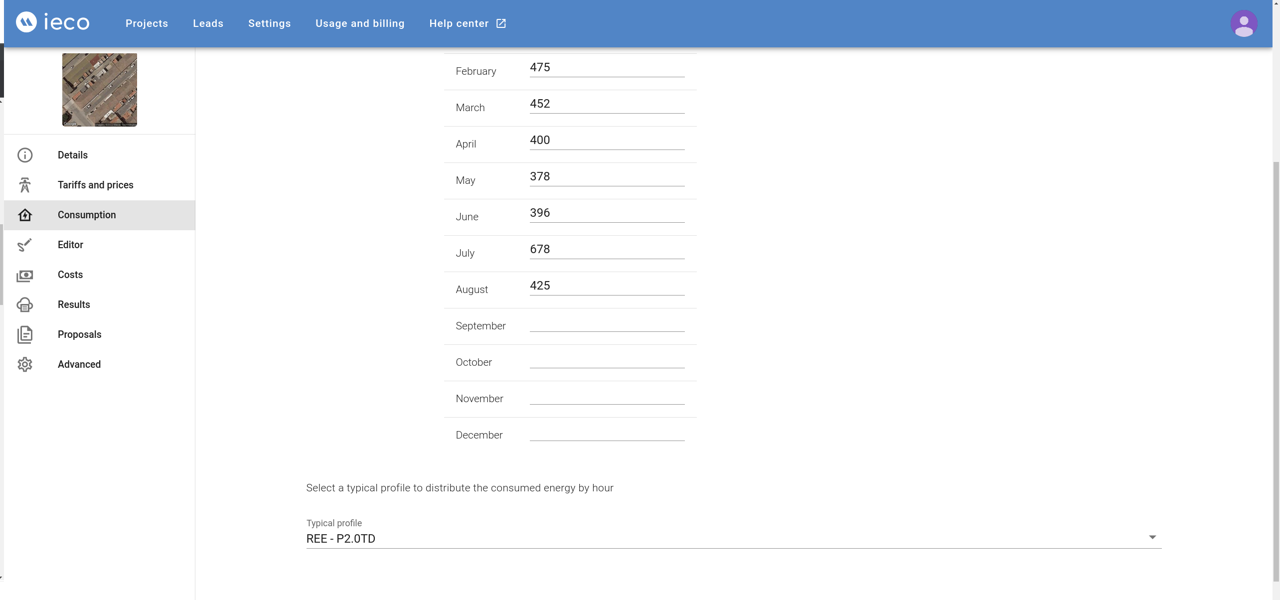
In this tutorial, we will leave the default option Monthly consumption checked and we will fill in until August, the rest of the months will be interpolated.
Next, the typical profile must be selected in order to be able to distribute consumption on an hourly basis. In this case we will select the REE-P2.0TD profile. You can find more information about the available profiles in the article Typical consumption profiles.
Proposal and results for the client
Finally click on the results section. From there you can preview the proposal to send to your client. The report is interactive:
- The scene can be zoomed in, zoomed out, moved or rotated just like from the editor itself. In addition, if you click on the bottom menu where a black square appears, a menu opens with which you can simulate the projection of shadows at different times and times of the year.
- You can click each time you see an i surrounded by a blue circle to see more information about the corresponding section,
- For the graphs, if you hover the mouse over them, specific values are displayed.
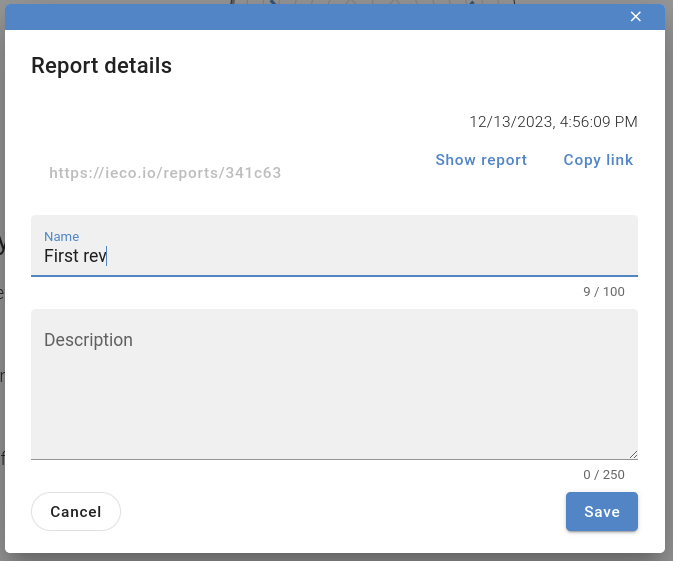
Sharing the proposal
To make the report public and share it, click on the Generate revision button at the end of the document. You will then see a window where you can name the proposal. If you click on view proposal you will see a window with the proposal. You can click on copy link to share the proposal (also downloadable in PDF).
Multiple proposals
Proposals are like pictures of the project, once generated they cannot be modified, but you can make as many proposals as you want within the same project.
For example, click on the prices tab, now modify the imported energy prices and click again on the results tab to see how the savings results change.
Repeat the sharing step and you will have the new proposal ready to share.
To view all the reports generated for this project and delete those you are no longer interested in, click on the proposals section. You will also be able to edit previous proposals and use different buttons to access functionalities such as the generation of the single-line diagram.
Congratulations! You have already designed your first residential project and generated two possible proposals for your client 👏.