Rentabilité
L'une des sections les plus importantes de la proposition pour votre client est celle qui détaille les résultats des économies et de la rentabilité, à la fois mensuels (première année) et totaux (pendant toute la durée de la simulation).
Ces résultats tiennent compte de l'énergie autoconsommée et de l'énergie injectée dans le réseau, ainsi que des prix de l'énergie pour chaque heure de l'année et des taxes en fonction du pays.
Mensuel
Dans cette section, votre client peut voir les économies totales et mensuelles de la première année.
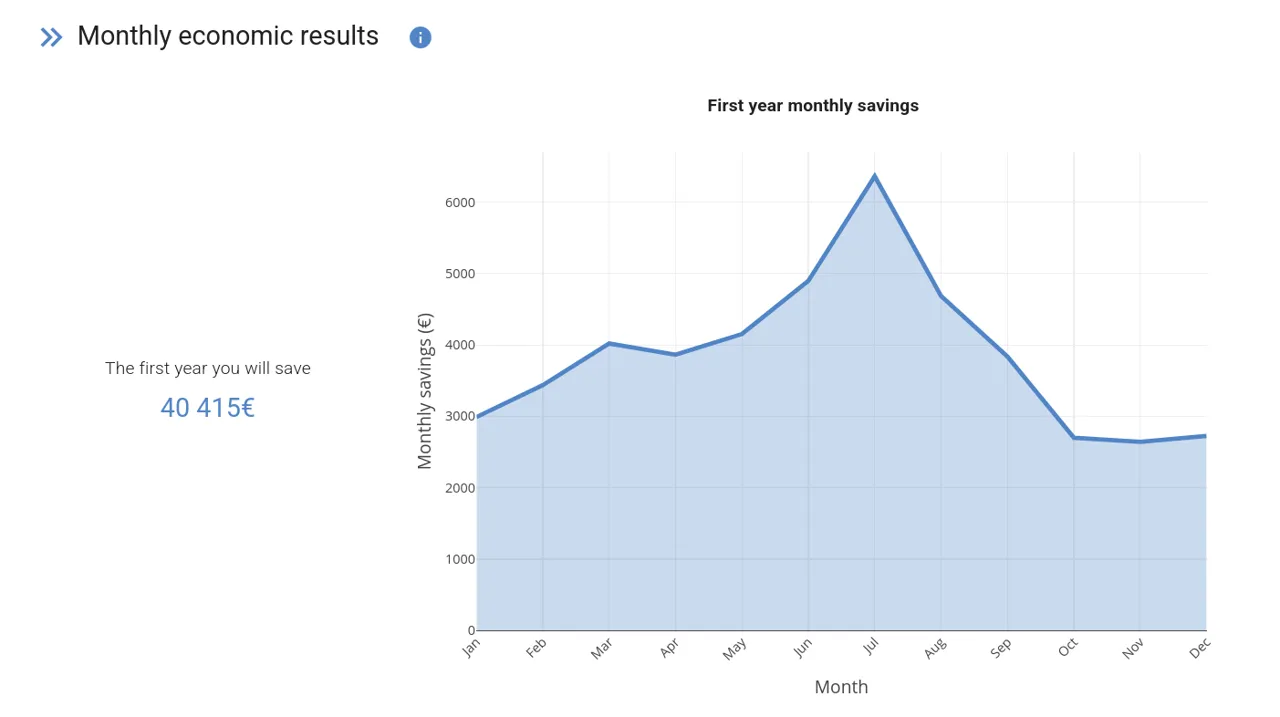
INFO
Ce graphique peut parfois présenter des « pics », comme on peut le voir en mars et en juillet dans l'exemple. Ces pics ne sont pas dus à des changements soudains dans la production, mais à des changements soudains dans les tarifs, dont le prix peut varier en fonction du mois de l'année.
Total
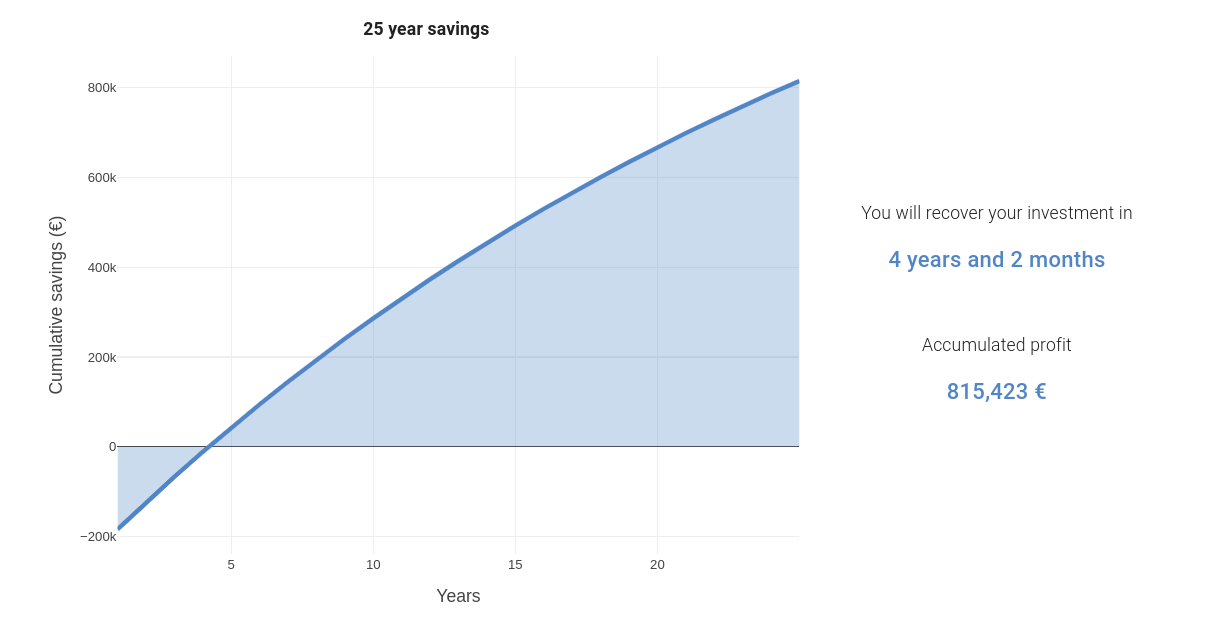
Ce graphique permet à votre client de visualiser le flux de trésorerie de l'investissement sur la période de simulation (généralement 25 ans), en tenant compte des paramètres financiers.
Les économies attendues sont calculées de la même manière que le graphique des performances économiques mensuelles.
Le délai de récupération représente le mois au cours duquel le flux de trésorerie accumulé commence à devenir positif.
Le bénéfice accumulé est le bénéfice final après la période de simulation. Comme il s'agit d'un flux de trésorerie dynamique avec application d'un taux d'actualisation, cette valeur représente la Valeur actuelle nette (VAN) de l'investissement.